
Key KPIs Every Small Business Should Measure: A Complete Guide for Indian Entrepreneurs
Table of Contents
- Understanding KPIs: Essential for Data-Driven Decisions
- Financial Key Performance Indicators: The Backbone of Your Business
- Tracking Online Performance: Digital Marketing KPIs
- Measurement of operational KPIs: Streamlining your Business Processes
- Customer-Centric KPIs: Building Loyalty in a Competitive Landscape
- Industry-Specific KPIs
- Setting Up Your KPI Tracking System: Practical Steps
- Five KPI Pitfalls for Indian Small Businesses to Avoid
- Methods for Calculating ROI in the Indian Market
- Conclusion: From Data to Action
Running a small business in India involves making countless decisions every day. But how do you know whether your business is moving in the right direction? Tracking the right KPIs for small businesses can provide the data you need to evaluate performance, identify problems, and make informed decisions.
Not every metric deserves equal attention. Vanity metrics may look impressive but often provide limited insight into actual business performance. This guide will help you identify the essential business metrics to track, understand what they reveal about your business, and use them effectively to monitor growth and improve performance in the Indian market.
Understanding KPIs: Essential for Data-Driven Decisions
What are KPIs and why do they matter for small businesses?
Key Performance Indicators (KPIs) are measurable values that show how effectively a business is progressing towards its goals. Think of KPIs as your business’s vital signs. Just as a doctor uses indicators such as heart rate and blood pressure to assess a person’s health, KPIs help you evaluate your business’s performance and identify areas that need attention.
For small businesses in India, where every rupee counts, monitoring KPIs isn’t just beneficial; it’s crucial for survival. CB Insights’ 2026 analysis of 431 startup failures found that 43% involved poor product-market fit, highlighting the importance of continuously monitoring customer demand and market response.
Metrics vs. KPIs: What’s the Difference?
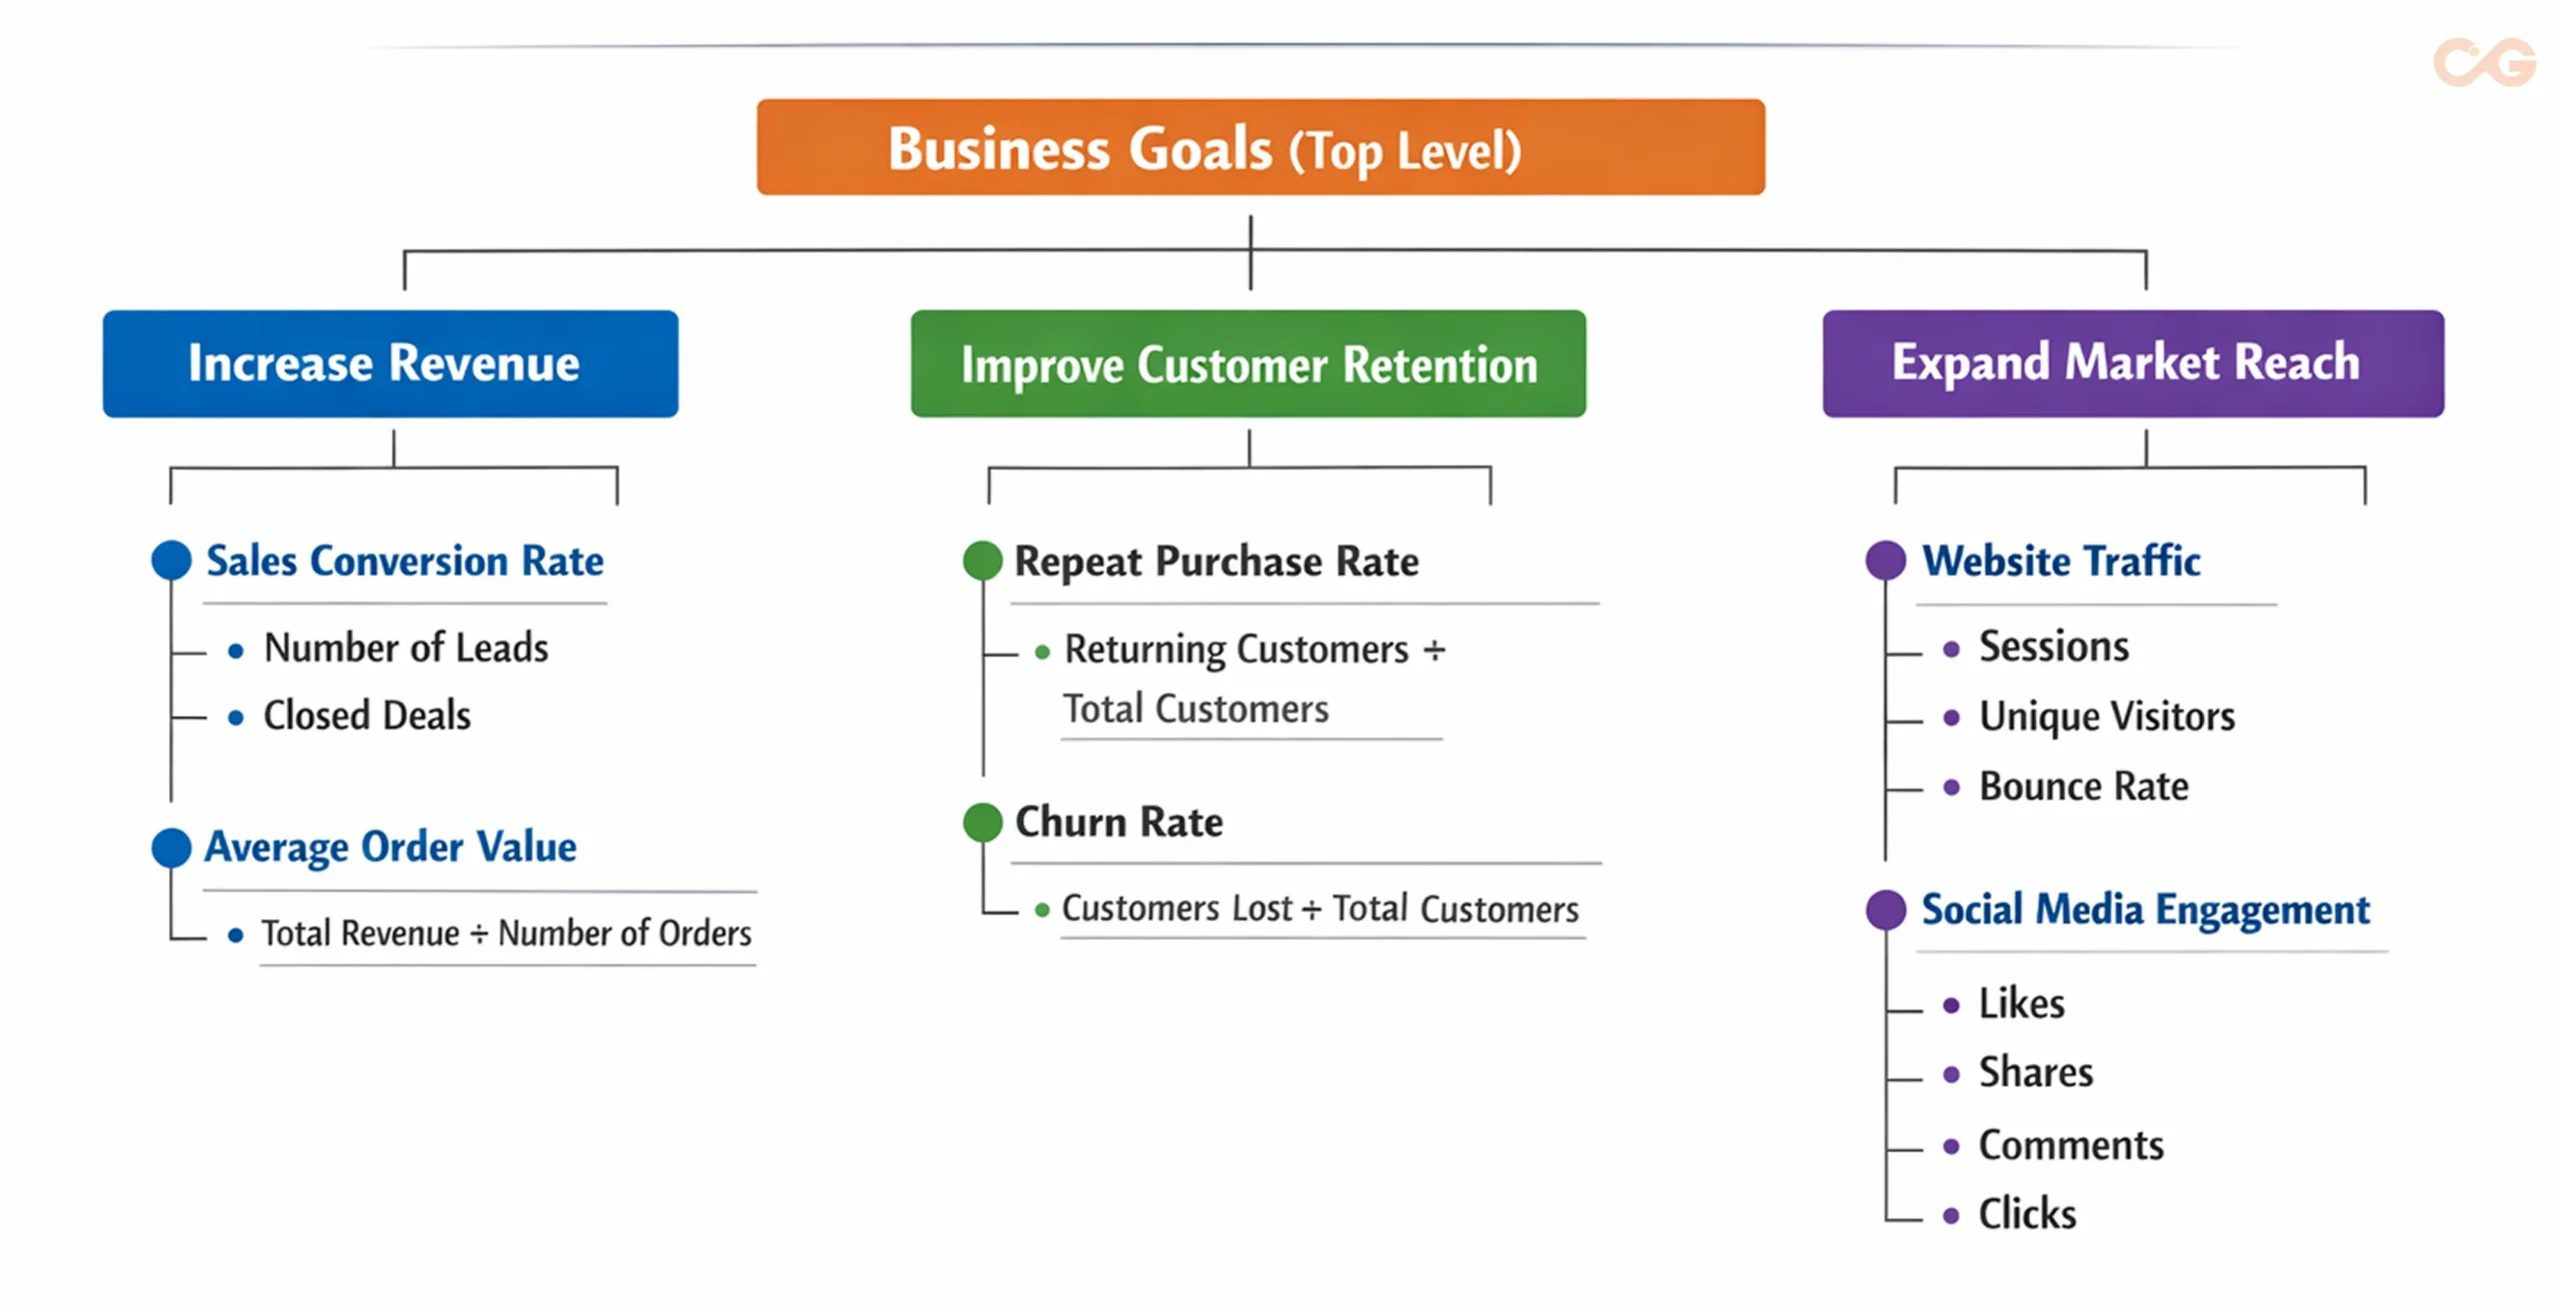
While the terms are often mixed up, there’s a clear distinction. Any quantifiable data is a metric, such as website visitors, social media followers, or email open rates. KPIs, however, are specific metrics linked directly to your business goals. All KPIs are metrics, but not all metrics qualify as KPIs.
For example, if you run a boutique clothing store in Mumbai, the number of Instagram followers is merely a metric. However, the conversion rate from Instagram to actual sales is a KPI since it directly impacts your revenue.
By focusing on the right KPIs, you’ll steer your business toward success. Stay informed, track what matters, and navigate confidently through the competitive landscape.
From Goals to Metrics: Understanding the KPI Hierarchy
Financial Key Performance Indicators: The Backbone of Your Business
Revenue Growth Rate
The revenue growth rate is a clear indicator of your business’s health. It shows whether your business is expanding, stagnating, or declining.
Formula: [(Current Period Revenue – Previous Period Revenue) / Previous Period Revenue] × 100
For small businesses in India, tracking monthly revenue growth is crucial because seasonal trends can significantly influence sales. For example, retailers may see higher sales during Diwali and wedding seasons, while businesses in industries such as travel, education, and hospitality may experience different seasonal demand patterns.
Gross Profit Margin
Gross profit margin indicates how much money remains after covering the direct costs of your goods or services.
Formula: [(Revenue – Cost of Goods Sold) / Revenue] × 100
In India’s price-sensitive market, balancing a healthy profit margin with competitiveness is essential. Profit margins vary significantly by industry. For instance, software services often enjoy margins of 75-85%, while retail typically ranges from 30-45%, based on Gross Margin research.
Tip: Small businesses can boost profit margins by negotiating favourable long-term rates with suppliers, optimising inventory management, utilising technology to improve efficiency, adopting value-based pricing, and exploring direct-to-consumer sales to reduce costs.
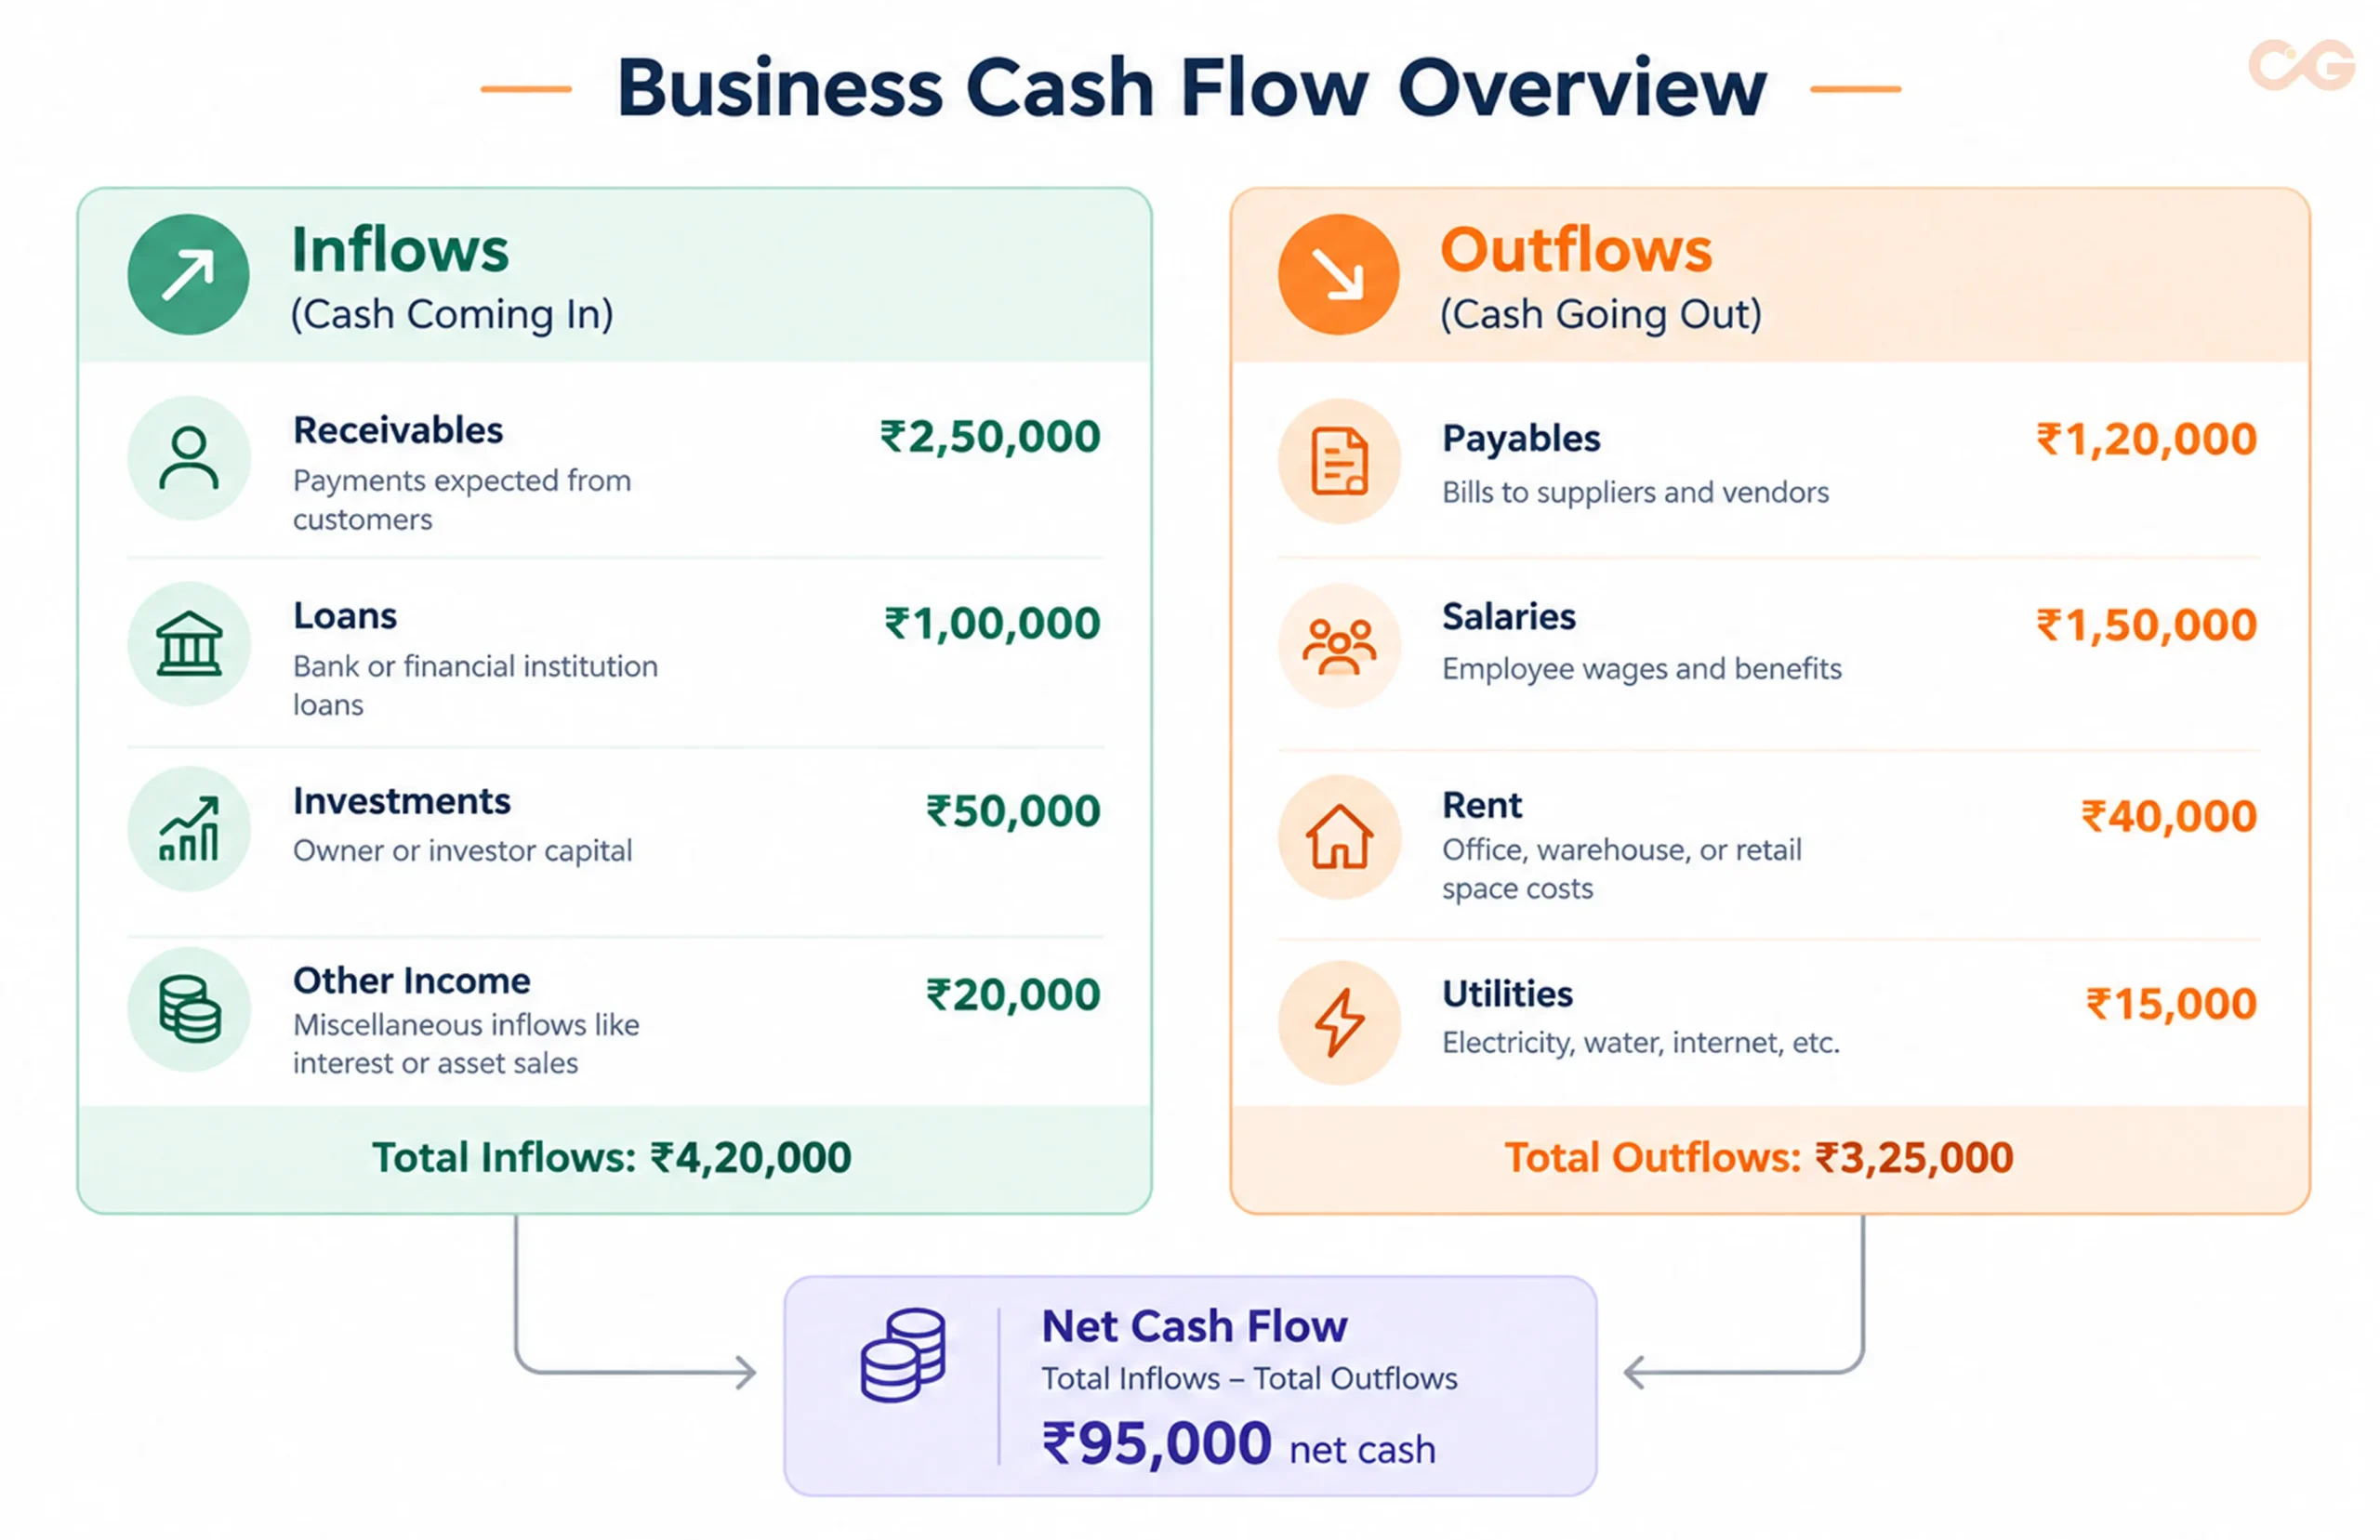
Cash Flow
Cash flow tracks the money entering and leaving your business. Poor cash flow management can lead to the downfall of even profitable companies, a common challenge faced by Indian SMEs due to late payments.
Formula: Cash Flow = Operating Cash Flow + Investing Cash Flow + Financing Cash Flow
Small businesses in India must closely monitor cash flow, especially regarding working capital. Many successful entrepreneurs follow the Rule of 40, keeping at least 40 days’ worth of operating expenses available in liquid cash.
Regular cash flow audits can help ensure your business stays on track and avoids financial pitfalls.
Customer Acquisition Cost (CAC)
Customer Acquisition Cost (CAC) helps you see how much you invest to gain each new customer. This includes costs from sales and digital marketing efforts.
Formula: Total Sales and Marketing Costs/Number of New Customers Acquired
For small businesses in India, CAC varies significantly across different channels. Current industry data reveals that average CAC for basic plans includes:
- Social Media Marketing: ₹8,000 – ₹15,000 per month
- Google Ads: ₹10,000 – ₹30,000 per month
- Organic Content Marketing: ₹2,000 – ₹4,000 per piece, according to Digital Sky 360.
People Also Ask: How much do small businesses in India spend on acquiring customers?
Ideally, your CAC should not exceed one-third of your Customer Lifetime Value (CLV). For subscription models, aim to recover CAC within 12 months. In e-commerce, recover CAC with the first purchase to stay competitive.
Customer Lifetime Value (CLV)
CLV estimates the total revenue expected from a customer over their relationship with your company.
Formula: (Average Purchase Value × Purchase Frequency × Customer Lifespan)
Many Indian businesses underestimate CLV, focusing more on acquisition than retention. However, studies show that a mere 5% increase in customer retention can boost profits by 25% to 95%, according to the research of ClickPost.
Tracking Online Performance: Digital Marketing KPIs
In India’s rapidly growing digital landscape, knowing your digital marketing KPIs is vital. With approximately 1.09 billion internet users, your online presence directly affects your revenue, according to IWorld.
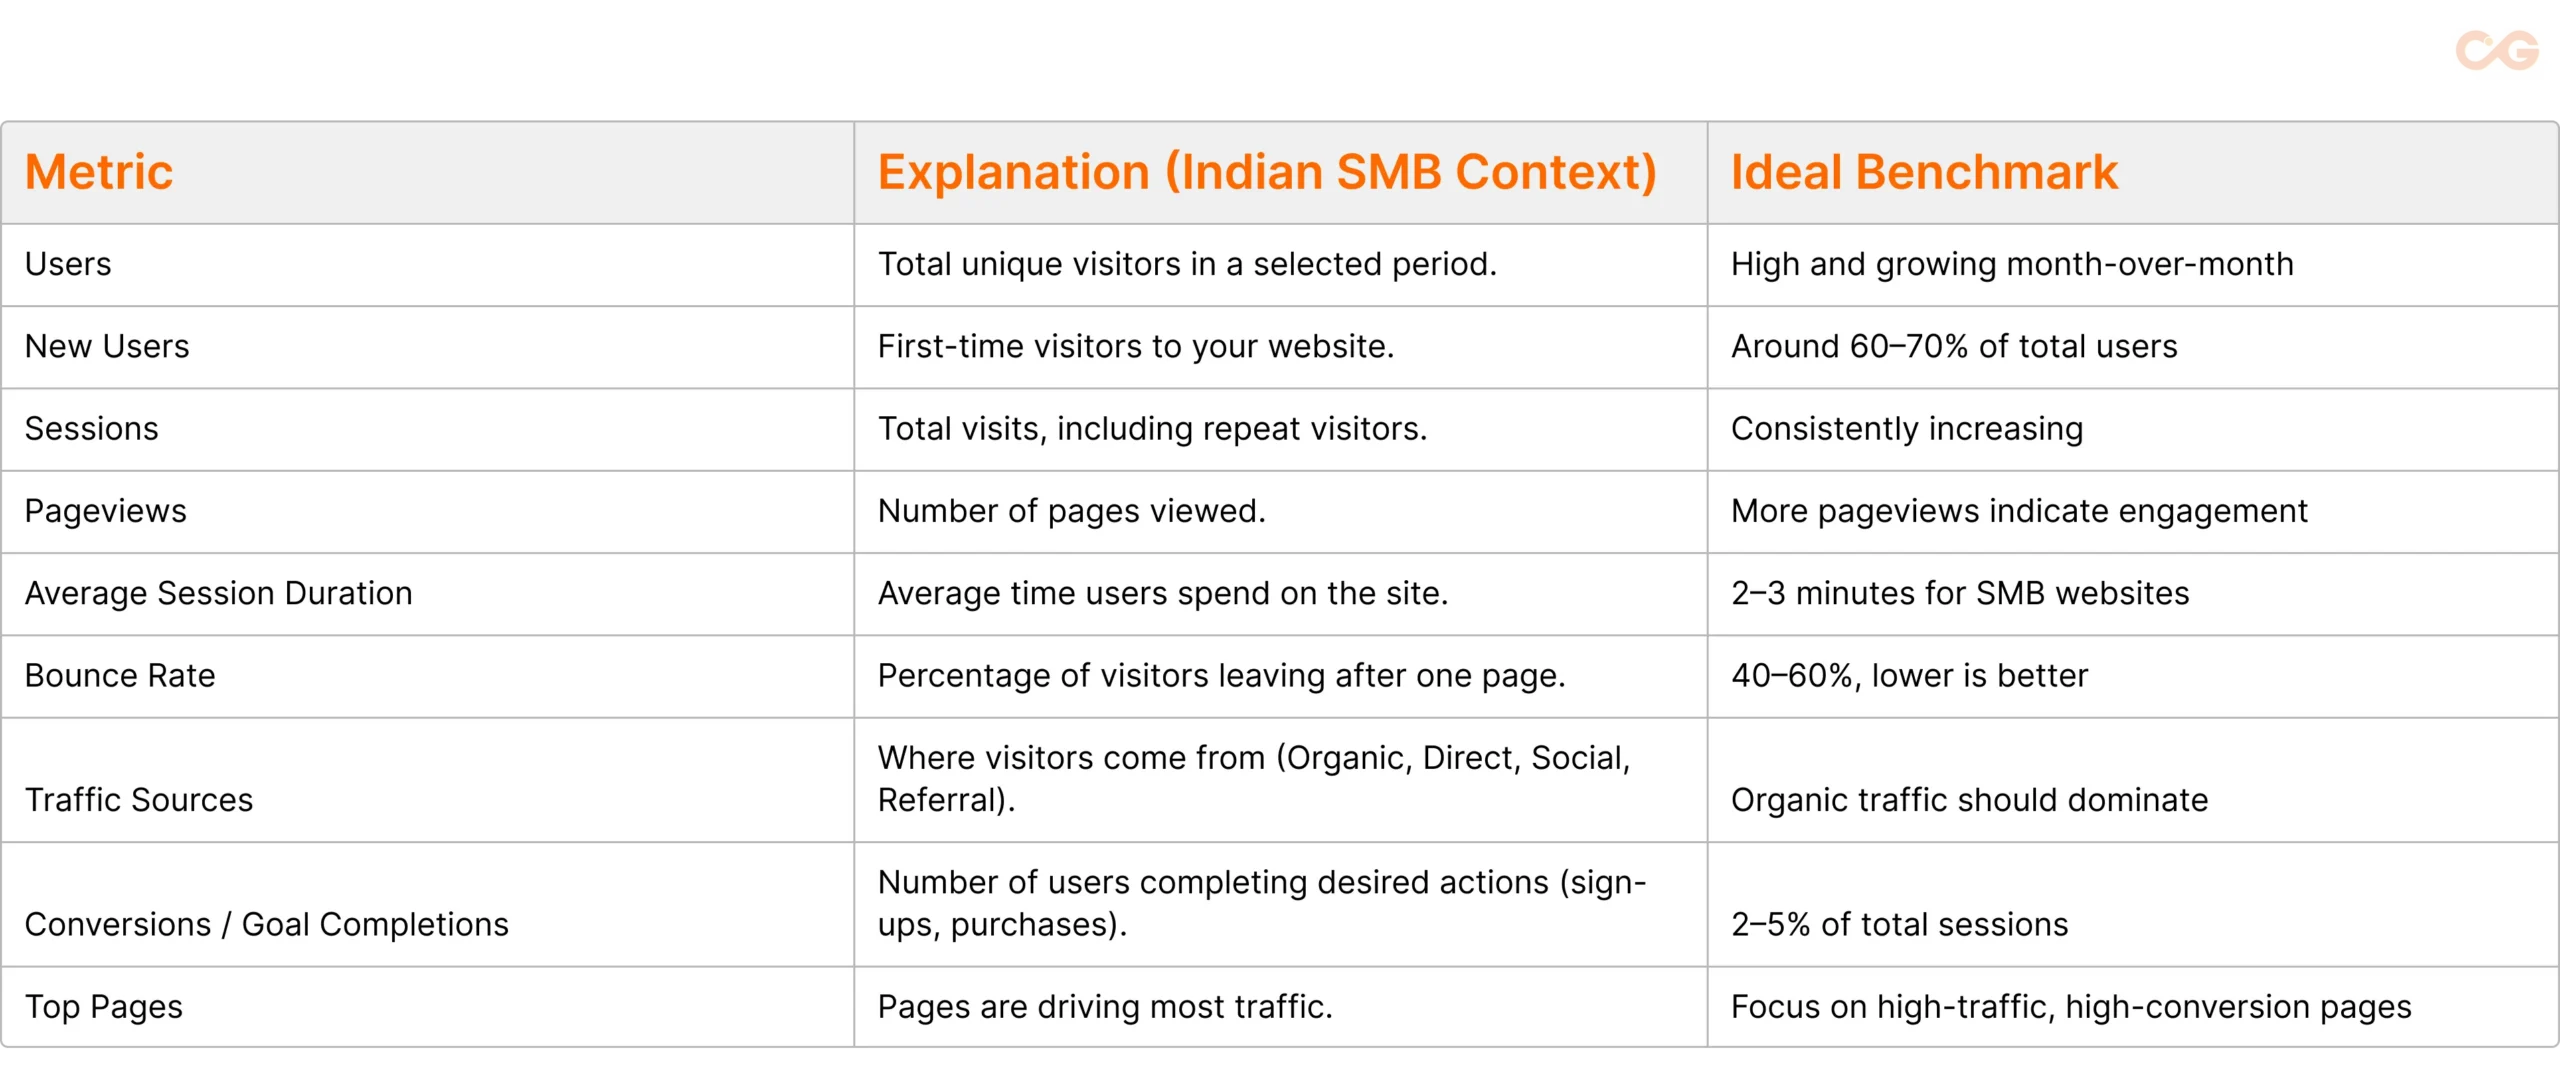
Traffic and Engagement Website Measures
Key Website Metrics:
Unique Visitors: This counts distinct individuals visiting your site. For Indian businesses, monitoring traffic sources — whether from organic search, social media, or paid advertising — is crucial.
Bounce Rate: This indicates the percentage of visitors who leave after viewing just one page. According to a Semrush study from August, here are some bounce rates for popular websites:
- Google: 32.51%
- ChatGPT: 35.98%
- Facebook: 50.03%
- WhatsApp: 56.97%
Average Session Duration: This measures how long visitors stay on your site. Indian users typically spend about 4 minutes and 56 seconds on healthcare websites, with mobile users often spending more time, according to Spectrum Infinite.
Cost-Effective Performance Measurement
Google Analytics serves as an excellent and free tool for marketing analytics tailored for small businesses.
Recommendations for Indian Businesses:
Focus on monitoring traffic data, including geographical insights (city and state), device type (mobile or desktop), and performance in Hindi and regional languages. Prioritise page load speed to ensure your digital content appeals to India’s diverse, mobile-first, and multilingual internet users.
Takeaway

Get the checklist today to simplify KPI tracking and enhance your business growth in measurable ways.
Google Analytics Dashboard for Indian Small Businesses
Conversion Rate
Your conversion rate measures how effectively you turn visitors into customers. This is a key goal for any digital marketing strategy aimed at small businesses.
Formula: (Average Purchase Value × Purchase Frequency × Customer Lifespan)
People Also Ask: What’s a good conversion rate for small businesses?
Generally, a rate above 3% is considered good. However, this can vary by industry and audience behaviour.
Industry Average Conversion Rates (according to CleverTap):
- Speciality e-commerce: 7.6%
- Software websites: 4.1%
- Fashion and accessories: 1.57%
- Food and beverages: 1.36%
Email Marketing Metrics (As per the research of benchmark)
Email marketing is effective in India, especially for B2B and educational sectors. Focus on the following metrics:
- Open Rate: The average for India is 9.05%. Tip: Use Hindi subject lines for better engagement with the right audience.
- Click-Through Rate (CTR): The average CTR in India is 0.84%. Emails perform better when sent during lunch hours (12:30-2:00 PM) and evening commutes (6-8 PM).
- Unsubscribe Rate: The average is 0.13%. An increase may indicate that your content is irrelevant or that you are sending too many emails.
Social Media KPIs
Social media platforms like WhatsApp, Instagram, and Facebook hold significant value in India.
- Engagement Rate: This measures likes, comments, and shares against total followers, usually around 2-5% according to Hootsuite.
- Reach and Impressions: These are essential for building brand awareness in India’s crowded online market.
- Social Commerce Conversion: Sales from Instagram Shopping and Facebook Marketplace are on the rise, reflecting the growth in social media commerce.
Measurement of operational KPIs: Streamlining your Business Processes
Operational KPIs help small businesses measure how efficiently their day-to-day processes are performing. Tracking metrics such as operational efficiency and productivity helps identify bottlenecks, reduce waste, and streamline business processes for better performance.
Inventory Turnover Ratio
For product-based companies, this metric shows how quickly you sell and restock inventory.
Formula: The cost of Goods Sold/Average Inventory Value
With high storage costs and significant working capital, optimising inventory turnover is crucial. Different industries have varying turnover rates based on factors like product demand and shelf life. Fast-moving items typically sell quicker than durable or high-value goods.
Monitoring this ratio helps maintain stock levels, reduce storage expenses, and improve cash flow, ultimately boosting profitability.
People Also Ask: What KPIs should Indian retailers monitor?
Apart from inventory turnover, focus on sales per square foot, foot traffic conversion, average transaction value, return rates, and stock-out frequency.
Employee Productivity Measures
Team productivity directly impacts your profitability. For service-based businesses, track revenue per employee. In manufacturing, monitor units produced per hour or shift.
In India, where labour laws differ and the gig economy grows, many companies are evaluating the productivity of full-time employees versus contractors. Revenue per employee is a crucial metric for assessing efficiency and labour utilisation across industries.
Order Fulfilment Time
Fast delivery is critical today. Track the time from when a customer places an order to when they receive it.
Quick delivery offers a competitive edge in India. In major cities, many businesses now achieve delivery within 24-48 hours. In tier-2 cities, expect 48-72 hours, and in tier-3 cities, delivery may take 3-5 days. This efficiency can enhance customer satisfaction and competitiveness.
Customer-Centric KPIs: Building Loyalty in a Competitive Landscape
Customer-centric KPIs help small businesses understand how satisfied customers are, whether they stay loyal, and how likely they are to recommend the brand. Tracking these metrics can help businesses strengthen customer retention, improve service quality, and build long-term relationships.
Customer Retention Rate
Customer Retention Rate measures the percentage of customers a business retains over a specific period, excluding newly acquired customers. A higher retention rate generally indicates stronger customer loyalty.
Formula: [(Customers at the End of the Period-New Customers)/Customers at the Start of the Period) x 100].
People Also Ask: What can small businesses do to enhance customer retention in India?
To boost customer retention, focus on tiered loyalty programs, personalised communication, and efficient after-sales support. Brands offering exclusive festive deals and building communities on platforms like WhatsApp or Facebook can foster deeper customer engagement and loyalty.
Net Promoter Score (NPS)
Net Promoter Score (NPS) measures how likely customers are to recommend your business to others. It can help identify your most loyal customers as well as those who may need better service.
Formula: Percentage of Promoters (score 9-10) – Percentage of Detractors (score 0-6).
- Promoters (9-10): Loyal customers who recommend your brand.
- Passives (7-8): Satisfied but unengaged; they don’t impact your score.
- Detractors (0-6): Unhappy customers who may deter others.
Customer Satisfaction Score (CSAT)
Customer Satisfaction Score (CSAT) measures how satisfied customers are with a specific interaction, purchase, product, or service.
Formula: (Number of Satisfied Customers/ Number of Responses) x 100
In India, using local languages in CSAT surveys can boost response rates. Keep surveys short — only 2-3 questions work best for Indian customers.
Industry-Specific KPIs
E-commerce and Retail
Cart Abandonment Rate: Currently at 70.22%. Causes include unexpected shipping costs and complex checkout processes, according to Baymard Institute.
Formula: (Carts created-purchases completed)/carts created x 100
Strategies to Reduce Abandonment:
- Offer cash on delivery.
- Display all costs upfront.
- Support UPI and digital wallets.
- Allow guest checkouts and send SMS or WhatsApp notifications for abandoned carts.
Return Rate: Indicates the percentage of orders returned. High return rates, averaging 16.9% in e-commerce, signal potential issues with product quality or descriptions, according to Channelwill.
Service-Based Businesses
Billable Utilisation Rate: For consultancies and professional service businesses, this metric measures the percentage of available working hours spent on billable client work.
Formula: (Billable Hours /Total Available Hours) x 100
Indian service companies need to maximise billable utilisation to avoid pricing or project management inefficiencies.
Project Completion Rate: This metric assesses how many projects are completed on time and within budget, while meeting client expectations.
SaaS and Subscription Businesses
Monthly Recurring Revenue (MRR): This steady income from subscriptions helps businesses forecast growth and manage cash flow.
Churn Rate: Reflects the percentage of customers who cancel subscriptions, highlighting retention challenges and areas for improvement.
Challenges for Indian SaaS Companies
Indian SaaS businesses often face issues like price sensitivity, preferences for annual plans, competition from free alternatives, and low credit card usage, which complicate pricing strategies.
Solutions for Success
Top Indian SaaS firms tackle these challenges by:
- Offering localised pricing lower than international rates.
- Accepting payments via UPI and net banking.
- Providing substantial discounts on subscription plans.
- Delivering customer service in local languages.
Healthcare and Wellness
Patient Retention Rate: Measures loyalty by tracking how many patients return over time.
Average Revenue Per Patient: This metric measures the average revenue generated from each patient and helps healthcare businesses evaluate pricing, service mix, and revenue opportunities.
Appointment No-Show Rate: Indicates the percentage of missed appointments, showing inefficiencies. No-show rates range from 5-30% in healthcare, as per Curogram. Reduce this with SMS reminders 24 hours prior and WhatsApp confirmations.
Food and Beverage
Table Turnover Rate: Measures how efficiently restaurants serve guests.
Table Turnover Rate: Total Guests Served (or Parties)/ Number of Tables.
Table Turnover Target: Restaurants are encouraged to have higher turnover of tables at lunch and dinner times since this will help them to have the maximum seating capacity and revenue potential.
Online Order Monitoring: Track revenue from delivery platforms and dine-in services to manage commissions and improve operations while optimising promotional efforts.
Setting Up Your KPI Tracking System: Practical Steps
Choosing the Right Tools for Indian Small Businesses
Indian SMEs often contend with budget limitations. Here’s a straightforward approach to measuring business performance metrics:
Free Options (₹0/month):
- Google Analytics: This tool tracks website traffic, user activity, and overall online business performance, helping you understand customer interaction and refine your online strategy.
- Google Search Console: Use this to monitor your SEO success, indexing status, and search performance, offering actionable insights for improving organic search.
- Facebook/Instagram Insights: Track social media metrics, engagement levels, outreach, and follower growth to evaluate content performance and audience behaviour.
- Google Sheets: Create manual KPI dashboards and conduct basic data analysis, enabling custom reporting and visualisation for small teams.
- Zoho Analytics Free Plan: This entry-level tool provides basic dashboards and reports to monitor key metrics even with minimal user data.
Budget-Friendly Options (₹500-₹2,000/month):
- Zoho Analytics: A comprehensive dashboard with extensive reporting features tailored for Indian businesses.
- Databox: This platform offers multi-source KPI dashboards, aggregating data from over 130 platforms to assess overall performance.
- Google Data Studio: An open-source tool for crafting interactive reports and customizable dashboards.
- Razorpay Dashboard: Specifically designed for Indian businesses, it focuses on payments and transaction analytics, allowing you to track financial KPIs.
Growth Options (₹2,000-₹10,000/month):
- Zoho One: A complete business solution, encompassing CRM, analytics, and marketing for end-to-end management.
- HubSpot: Provides metrics for marketing, sales, and service at affordable, scalable prices for startups.
- CleverTap: Delivers advanced mobile analytics and user engagement metrics specifically for Indian firms.
- Freshworks: Offers cost-effective customer engagement tracking, tailored for Indian companies to enhance support and retention.
People Also Ask: What can small businesses do to enhance customer retention in India?
In addition to Google Analytics, tools like GST portal stats, UPI dashboards, WhatsApp Business data, Instagram Shopping insights, and YouTube analytics can also yield valuable information for tracking sales, payments, customer feedback, social commerce, and video marketing results.
Crafting an Effective KPI Dashboard
1. Identify Key KPIs: Choose 5-7 critical metrics that influence your business objectives. Avoid tracking too many KPIs to maintain clarity and actionable insights.
2. Select Dashboard Format:
- Daily Dashboard: Monitor sales, web traffic, and customer inquiries for quick decision-making.
- Weekly Dashboard: Assess short-term performance by tracking conversion rates, marketing ROI, and cash flow.
- Monthly Dashboard: Review long-term indicators like revenue growth, profit margins, and customer acquisition costs for strategic planning.
3. Organise Data Collection: Ensure all systems — like accounting software, CRM, and marketing tools — are synced, allowing data to flow seamlessly into your dashboard for timely reporting.
4. Set Targets: Base your targets on industry standards and past performance to create ambitious yet achievable goals that drive improvement.
5. Schedule Reviews: Conduct daily quick checks, team reviews weekly, and in-depth examinations monthly to stay on top of trends, adapt strategies, and align with business goals.
Takeaway
Get the checklist today to simplify KPI tracking and enhance your business growth in measurable ways.
Establishing Benchmarks and Setting KPI Targets
Once you have identified the right KPIs, the next step is to determine what good performance looks like. Use a combination of industry benchmarks, historical business data, and competitor insights to set realistic targets.
1. Industry Benchmarks
Use relevant industry data from credible organisations such as the National Association of Software and Service Companies (NASSCOM) for technology, the Confederation of Indian Industry (CII) for manufacturing, and the Retailers Association of India (RAI) for retail. These benchmarks can help you understand how your business performs relative to industry standards.
2. Historical Data
Review your monthly, quarterly, and annual KPI data to identify trends and establish a realistic baseline. For example, if your conversion rate has consistently increased from 2% to 3% over the past year, you could set a target of reaching 3.5% rather than choosing an arbitrary figure.
3. Competitor Analysis
Analyse publicly available information, customer reviews, pricing, service offerings, and marketing activities to understand competitor performance and identify opportunities. Avoid copying competitor targets directly; instead, use these insights to identify areas where your business can improve and differentiate itself.
Set SMART KPI Targets
Use the SMART framework to turn your benchmarks into actionable targets:
- Specific: Define exactly what you want to improve, such as increasing website conversion rates from 3% to 4%.
- Measurable: Set targets that can be tracked using clear, quantifiable metrics.
- Achievable: Base targets on your resources, team capacity, historical performance, and market conditions.
- Relevant: Ensure each KPI supports a broader business objective, such as increasing revenue, reducing costs, or improving customer retention.
- Time-bound: Set a clear deadline for achieving the target, such as increasing the conversion rate to 4% within six months.
Combining external benchmarks with your own performance data gives you a more realistic view of where your business stands. SMART targets then turn these insights into clear, measurable actions that your team can monitor and improve over time.
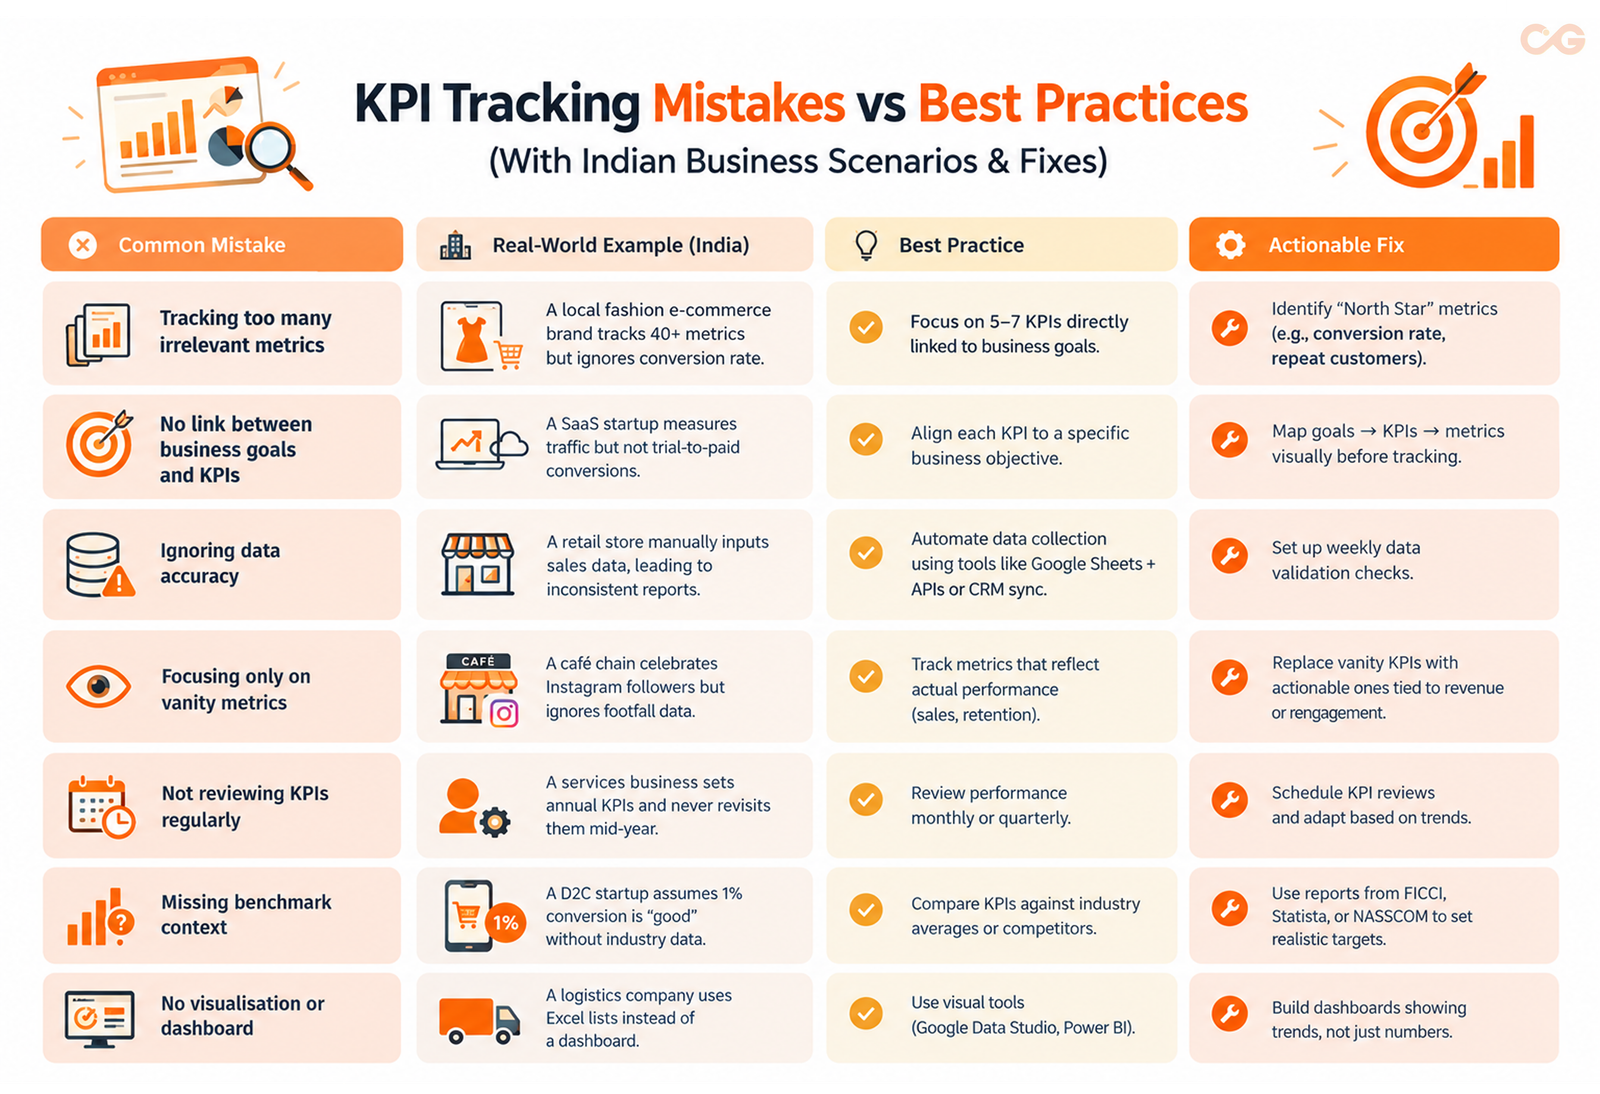
Five KPI Pitfalls for Indian Small Businesses to Avoid
Vanity Metrics
Many businesses get sidetracked by appealing but meaningless numbers. Metrics like social media followers, page views, or email subscriber counts look impressive but don’t pay the bills.
Focus instead on metrics that matter: track social media engagement alongside sales conversions, monitor conversion rates relative to traffic, and evaluate email click-through rates against actual purchases. These provide a clearer picture of performance.
Analysis Paralysis
Tracking too many KPIs can lead to confusion and inaction. Harsh Mariwala’s 8 Mantras stress the importance of prioritising. Businesses should focus on a few key areas rather than trying to manage everything at once to achieve sustainable growth, according to the report of Business Standard.
Lack of Context
A change in revenue or another KPI may appear concerning when viewed in isolation. Compare performance with the same period from the previous year to account for seasonality, review previous periods to identify trends, and use relevant industry benchmarks to understand how your business compares with the market. Putting KPI results into context helps turn raw numbers into meaningful, actionable insights.
Failing to Act on Insights
Tracking KPIs has little value if the insights are not translated into action. When a KPI falls below its target, follow a structured approach:
1. Identify the Cause: Analyse the data to determine what is driving the change and identify the underlying issue.
2. Develop Solutions: Work with your team to identify practical solutions based on the root cause.
3. Implement Changes: Put the selected solution into action by assigning clear responsibilities, setting timelines, and defining success metrics.
4. Monitor Results: Track the KPI regularly, compare results against the target, and refine your approach based on what the data shows.
Setting Unrealistic Goals
Ambitious targets can motivate teams, but unrealistic expectations can lead to frustration and disengagement when they consistently remain out of reach. Set challenging but achievable goals based on historical performance, available resources, market conditions, and industry benchmarks. Review and adjust targets as your business grows to keep them both motivating and realistic.
Methods for Calculating ROI in the Indian Market
People Also Ask: How can I calculate marketing ROI in India?
The fundamental formula is clear:
Marketing ROI = (Revenue gained due to Marketing – Marketing Cost)/Marketing Cost) × 100.
However, adjustments are necessary for the Indian market:
Challenges in Attribution
Many Indian consumers research products online but buy them in-store, complicating accurate performance measurement.
Solutions for Attribution Challenges:
- Use unique promo codes or coupons tied to online campaigns to track offline sales effectively.
- Integrate CRM with POS systems for a complete understanding of customer habits.
- Collect in-store feedback to find out how customers discovered the product online.
- Analyse online engagement trends alongside offline purchases to refine marketing strategies.
Delayed Conversions:
In B2B sales, the typical cycle lasts 3-6 months. Implement multi-touch attribution models to gather various attributions across the customer journey.
ROI by Channel in India
Google Ads:
Google Ads typically delivers an ROI ranging from 2:1 to 4:1 in India, reflecting earnings of ₹176 on a ₹88 investment, as per Enhencer. Performance is often stronger in Tier-1 cities, and targeting Hindi keywords can yield cost-effective results.
Facebook and Instagram Ads:
Facebook ads show an average return on ad spend (ROAS) of 3.8:1, while Instagram boasts 4.2:1, according to the research of SocialPulseStats. Both platforms excel in B2C marketing, with 88% of marketers noting that video content is particularly engaging and lucrative, as per the research of VisualBest.
Content Marketing:
Content marketing provides a long-term ROI of between 5:1 and 13:1, according to HumansWithAI. Expect results in 6-12 months through enhanced brand growth and improved organic SEO presence with English and Hindi content.
WhatsApp Marketing:
ROI for WhatsApp marketing in India ranges from 200% to 800%, as per Bird. Its high open rates (over 90%) make it effective for repeat sales, customer retention, and establishing direct communication with buyers, according to the research of Insider.
Takeaway
Get the checklist today to simplify KPI tracking and enhance your business growth in measurable ways.
Conclusion: From Data to Action
For Indian small businesses, tracking key performance indicators (KPIs) isn’t just about numbers — it’s about clarity. The metrics you choose should simplify your path to success instead of complicating it.
Key Principles to Remember:
- Keep It Simple: Start with 5-7 essential KPIs to maintain focus.
- Stay Consistent: Regularly monitor your KPIs. Consistency matters more than perfection.
- Take Action: Use insights from your KPIs to drive improvements in your business.
- Be Adaptable: Update your KPIs as business goals or market conditions change.
- Promote Transparency: Share KPI results with your team to enhance collaboration and accountability.
For Indian small businesses, having clear digital marketing KPIs is crucial for survival in a rapidly evolving market. The companies that blend entrepreneurial instincts with data-driven decisions will thrive in the next decade.
Act now. Choose five crucial KPIs for your small business in India. Set up basic tracking. Review your progress weekly and adjust quarterly. In six months, you’ll gain insights that your competitors might lack — giving you a significant edge.
Avoid guesswork. Achieve clarity by systematically tracking your KPIs.
FAQs
What are the top 5 KPIs for small businesses?
For small businesses, the five critical KPIs are: 1) Revenue Growth Rate, 2) Gross Profit Margin, 3) Customer Acquisition Cost, 4) Cash Flow, and 5) Customer Retention Rate. These indicators provide insights into your financial health, marketing effectiveness, and customer loyalty.
How often should I check my business KPIs?
Review operational KPIs daily to weekly, marketing KPIs weekly or bi-weekly, and strategic financial KPIs monthly. Conduct in-depth assessments quarterly to uncover long-term trends and make informed strategic decisions.
Can I track KPIs without expensive software?
Yes, you can. Start with free tools like Google Analytics, use Google Sheets for dashboards, and leverage the reporting features of your existing accounting software. Many businesses have successfully tracked KPIs using these free resources before upgrading to paid solutions.
What’s the difference between leading and lagging indicators?
Leading indicators predict future performance, like website traffic and forecasting sales, while lagging indicators reflect past performance, such as last month’s revenue. Balance both to gain comprehensive business insights.
How can I tell if my KPIs are performing well?
Evaluate your KPIs against three benchmarks: your past performance (are you improving?), industry standards (how do you compare to competitors?), and your set goals (are you meeting objectives?). Context matters more than absolute figures.